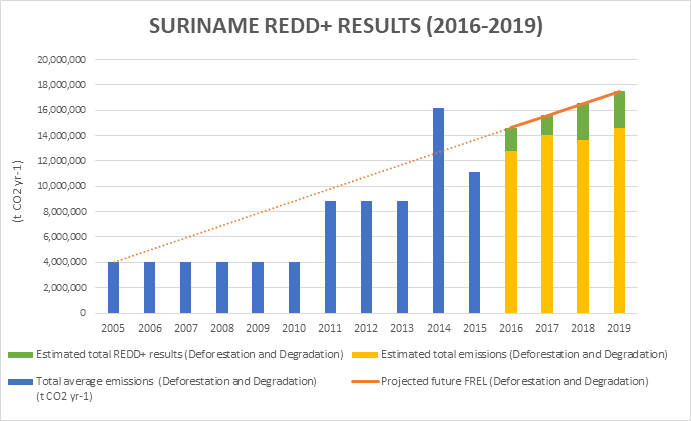
Total Average emissions due to Deforestation and degradation
According to the FREL submitted, the expected emissions for 2016, 2017, 2018 and 2019 were 14,627,465, 15,591,284, 16,555,103 and 17,518,922 respectively. The total emissions estimated for these years for Suriname were 12,808,192, 14,064,739, 13,651,996, 14,588,869, having emission reduction results.