KOPI
Toggle navigation
About SBB:
Sign out
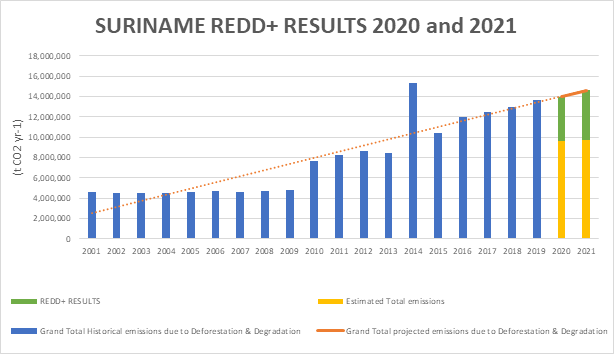
Trends in emissions in Suriname 2020-2021
Showing
1-10
of
21
items.
Comparison of estimated vs projected emissions for the years 2020 and 2021
Export Page Data
HTML
CSV
Text
Excel
JSON
All
#
Year
Historical Deforestation
Historical Degradation
Projected Deforestation
Projected Degradation
Estimated Deforestation
Estimated Degradation
Total Emissions (t CO2e yr-1)
1
2021
0.00
0.00
8,775,256.00
5,836,974.50
5,943,411.00
3,829,429.75
2
2020
0.00
0.00
8,420,597.00
5,588,292.00
6,040,835.50
3,870,703.00
3
2011
5,795,935.00
2,491,360.00
0.00
0.00
0.00
0.00
4
2019
6,858,725.00
6,799,757.00
0.00
0.00
0.00
0.00
5
2018
6,040,216.00
6,983,856.00
0.00
0.00
0.00
0.00
6
2017
7,340,615.00
5,130,517.00
0.00
0.00
0.00
0.00
7
2016
7,862,822.00
4,100,090.00
0.00
0.00
0.00
0.00
8
2015
6,320,143.00
4,127,237.00
0.00
0.00
0.00
0.00
9
2014
11,351,994.00
3,975,210.00
0.00
0.00
0.00
0.00
10
2013
5,795,935.00
2,625,418.00
0.00
0.00
0.00
0.00
Comparison of estimated vs projected emissions for the years 2020 and 2021
Showing
1-10
of
21
items.
REDD+ Results for Suriname for 2020 and 2021
Export Page Data
HTML
CSV
Text
Excel
JSON
All
#
Year
Historical Emissions
Projected Emissions
Estimated Emissions
Results
Total Emission (t CO2e yr-1)
1
2001
4,590,666.00
0.00
0.00
0.00
2
2002
4,537,967.00
0.00
0.00
0.00
3
2003
4,538,078.00
0.00
0.00
0.00
4
2004
4,550,330.00
0.00
0.00
0.00
5
2005
4,653,661.00
0.00
0.00
0.00
6
2006
4,708,898.00
0.00
0.00
0.00
7
2007
4,562,866.00
0.00
0.00
0.00
8
2008
4,716,286.00
0.00
0.00
0.00
9
2009
4,758,684.00
0.00
0.00
0.00
10
2010
7,674,347.00
0.00
0.00
0.00
Total estimated REDD+ results for 2020-2021
0.00
Sources:
REDD+ Web Platform
Suriname. Biennial update report (BUR). BUR 1.
Modified Technical Annex on REDD+ FREL1
 KOPI
KOPI