KOPI
Toggle navigation
About SBB:
Sign out
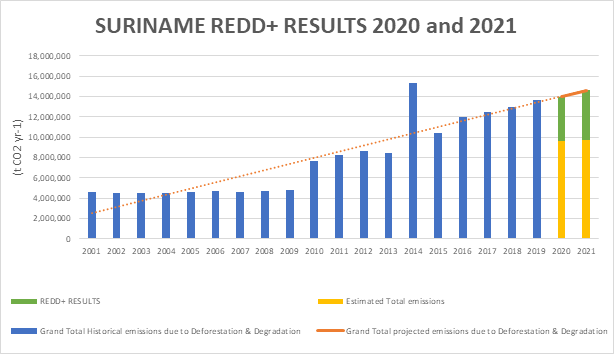
Trends in emissions in Suriname 2020-2021
Showing
1-10
of
21
items.
Comparison of estimated vs projected emissions for the years 2020 and 2021
Export Page Data
HTML
CSV
Text
Excel
JSON
All
#
Year
Historical Deforestation
Historical Degradation
Projected Deforestation
Projected Degradation
Estimated Deforestation
Estimated Degradation
Total Emissions (t CO2e yr-1)
1
2001
2,627,560.00
1,963,106.00
0.00
0.00
0.00
0.00
2
2002
2,627,560.00
1,910,407.00
0.00
0.00
0.00
0.00
3
2003
2,627,560.00
1,910,518.00
0.00
0.00
0.00
0.00
4
2004
2,627,560.00
1,922,770.00
0.00
0.00
0.00
0.00
5
2005
2,627,560.00
2,026,101.00
0.00
0.00
0.00
0.00
6
2006
2,627,560.00
2,081,338.00
0.00
0.00
0.00
0.00
7
2007
2,627,560.00
1,935,307.00
0.00
0.00
0.00
0.00
8
2008
2,627,560.00
2,088,726.00
0.00
0.00
0.00
0.00
9
2009
2,627,560.00
2,131,124.00
0.00
0.00
0.00
0.00
10
2010
5,795,935.00
1,878,412.00
0.00
0.00
0.00
0.00
Comparison of estimated vs projected emissions for the years 2020 and 2021
Total
21
items.
REDD+ Results for Suriname for 2020 and 2021
Export Page Data
HTML
CSV
Text
Excel
JSON
Page
#
Year
Historical Emissions
Projected Emissions
Estimated Emissions
Results
Total Emission (t CO2e yr-1)
1
2002
4,537,967.00
0.00
0.00
0.00
2
2019
13,658,481.00
0.00
0.00
0.00
3
2018
13,024,072.00
0.00
0.00
0.00
4
2017
12,471,132.00
0.00
0.00
0.00
5
2016
11,962,911.00
0.00
0.00
0.00
6
2015
10,447,381.00
0.00
0.00
0.00
7
2014
15,327,204.00
0.00
0.00
0.00
8
2013
8,421,353.00
0.00
0.00
0.00
9
2012
8,642,609.00
0.00
0.00
0.00
10
2011
8,287,294.00
0.00
0.00
0.00
11
2010
7,674,347.00
0.00
0.00
0.00
12
2009
4,758,684.00
0.00
0.00
0.00
13
2008
4,716,286.00
0.00
0.00
0.00
14
2007
4,562,866.00
0.00
0.00
0.00
15
2006
4,708,898.00
0.00
0.00
0.00
16
2005
4,653,661.00
0.00
0.00
0.00
17
2004
4,550,330.00
0.00
0.00
0.00
18
2003
4,538,078.00
0.00
0.00
0.00
19
2001
4,590,666.00
0.00
0.00
0.00
20
2020
0.00
14,008,889.00
9,911,538.00
4,097,351.00
21
2021
0.00
14,612,231.00
9,772,841.00
4,839,390.00
Total estimated REDD+ results for 2020-2021
8,936,741.00
Sources:
REDD+ Web Platform
Suriname. Biennial update report (BUR). BUR 1.
Modified Technical Annex on REDD+ FREL1
 KOPI
KOPI